Review of Open Source Color Blindness Simulations
There are lots of available programs for color blindness simulation, but many are actually very inaccurate. Let's find out what methods we can trust and what code can be safely copy/pasted :)


- Introduction
- Overview of the main existing approaches
- So which one should we use?
- I just want to copy some code!
- Show me some images!
- How accurate are these simulations?
- Conclusion
- Bibliography
Introduction
Why simulate color vision deficiencies (CVD)?
Color vision deficiencies (CVD), commonly called "color blindness" affects ~8% of the male population and ~0.4% of the female population. Being able to accurately simulate them is important for several reasons:
- Communicate about this issue and help other people understand it
- Help designers choose color schemes that everyone will perceive
- Create tools to enhance images and help color blind people in their daily tasks. Most correction tools start by simulating how a person with CVD would see the image, and then find some way to spread the lost information into the channels that are better perceived or playing with the light intensity to restore the contrast.
There are many online resources to understand CVD in detail. The wikipedia page, color-blindness.com and the chroma-phobe youtube channel are a good start, but here are some key facts to follow this article:
- Human color perception is achieved via cone cells in the retina. Humans with normal vision have 3 kinds of cells, sensitive to different light wavelengths. L cones capture Long-wavelength (~red), M cones capture Medium-wavelength (~green) and S cones capture Short-wavelength (~blue). Their response over the light spectrum is shown below.
. L is roughly centered on red, M on green and S on blue. Note that the responses overlap significantly, especially for the L and M cones.") .
.
-
Most color vision deficiencies can be explained by one type of cone cells not behaving properly. Protanopes, deuteranopes and tritanopes respectively lack or have malfunctioning L, M, or S cone cells.
-
CVD simulations based on physiological experiments generally consists in transforming the image to a color space where the influence of each kind of cone cells is explicit and can be decreased or removed easily. The LMS color space was designed to specifically match the human cone responses and is thus the choice of the vast majority of methods. So the typical pipeline consists in transforming the RGB image into LMS, applying the simulation there, and going back to RGB.
Making sense of the available models and programs
There are many methods to simulate color blindness, and we can easily find lots of open source programs to do so. However color perception theory is complex and most well-intentioned developers (like me!) end up copying existing algorithms without having a solid understanding of where they come from and which ones are best. It is also difficult to evaluate the accuracy of the simulations, so very bad simulations can still appear reasonable to an untrained observer.
While developing DaltonLens I got frustrated by this as I was trying to decide which method I should implement. And being a mild-protan myself, I was often not very convinced by the results of existing methods as they tended to make the simulated images way too exaggerated. But for the first version I had little time and copy/pasted some code for the daltonize filters, which turned out to be quite wrong.
So I've decided to dig further into the history of the available algorithms and try to understand where they come from and how much we can trust them.
Vocabulary notes
As it can get confusing, here is a summary of the main terms to describe CVD variants:
-
Dichromacy refers to one kind of cone cells fully missing. The corresponding deficiencies for each kind are called protanopia, deuteranopia and tritanopia. The color space of people with dichromacy (dichromats) is basically 2D instead of 3D.
-
Anomalous trichromacy refers to having one kind of cone cells with only a partial disfunction (e.g less density or with a shifted wavelength peak). The corresponding deficiencies are called protanomaly, deuteranomaly and tritanomaly. In software simulations the degree of severity is usually encoded as a float value between 0 (no deficiency) and 1 (dichromacy).
-
A protan or a protanope is a person suffering from protanopia ("strong" protan) or protanomaly ("mild" protan). Deutan/deuteranope and tritan/tritanope are defined similarly.
Overview of the main existing approaches
Let's start by looking at the most popular software and research papers. To complete this section I used the nice thread and software links compiled by Markku Laine.
Coblis and the HCIRN Color Blind Simulation function
A google search for "color blindness simulation" first returns color-blindness.com. I mentioned that website before because it has great introductory material, but it also proposes a CVD simulator, called Coblis. Being one of the oldest and easiest tool to test it has inspired lots of other software. But digging into the history of the code is interesting and shows that its accuracy is questionable, especially in the older version.
The simulator now relies on the source code of MaPePeR. It implements two different functions, one based on the "Color-Matrix" algorithm (Coblis v1), and one based on the "HCIRN Color Blind Simulation function" (Coblis v2, the default as of October 2021).
The "Color-Matrix" algorithm was developed by www.colorjack.com. He converted the "HCIRN Color Blind Simulation function" that works in the CIE-XYZ color-space into a faster matrix that directly works on RGB values (that kind of optimization mattered back then). He did so by running the full function on 3 RGB values (pure red, pure green, pure blue) to deduce the 3x3 transformation matrices. So this approach only ensures the equivalence for these 3 colors. It also ignores the non-linearity of sRGB images, which was approximately handled in the original code with a gamma function (more about sRGB in a followup post). The author himself later said that this was a one-night hack and that nobody should use it anymore in a comment on kaioa.com:
You're right, the ColorMatrix version is very simplified, and not accurate. I created that color matrix one night (http://www.colorjack.com/labs/colormatrix/) and since then it's shown up many places... I should probably take that page down before it spreads more! Anyways, it gives you an idea of what it might look like, but for the real thing... The author actually took down that page since then, but it's hard to stop the spread.
Regarding the proper "HCIRN Color Blind Simulation function", the first public code was developed by Matthew Wickline and made available as a javascript Color Blindness Library. The author says in the acknowledgments that he wrote it by adapting some Java code that he got from Thomas Wolfmaier after reading his 1999 article Designing for the Color-Challenged: A Challenge.
This article explains that they implemented a method based on the seminal work of (Meyer & Greenberg, 1988), who was the first to propose an actual algorithm to simulate CVD, in the CIE XYZ color space. However the implementation of Thomas Wolfmaier was not validated experimentally:
Has the model been validated on individuals with color vision deficiencies? Unfortunately, we have not yet been able to test the model. We did apply the model to some of the tables of the UMIST 'For Fun' Colour Vision Test and were able to reproduce the predicted confusions. If you have some form of color vision deficiency, please have a look at the design aids described in the following sections and let us know how well the model predicts the color you see.
How accurate is the model? The model provides only a rough approximation. It includes estimates for some properties of color vision defects as well as assumptions about the hardware on which the colors are displayed. It also does not account for the reduced sensitivity to reds of individuals with protan defects.
It is worth noting that (Meyer & Greenberg, 1988) did some experimental validation, where they noted that dichromats responded favorably to the simulations, despite some issues with highly saturated colors. (Viénot, Brettel, & Mollon, 1999) later commented that working in the CIE XYZ color space is worse as it does not take into account the altered perception of luminosity for dichromats.
So, to summarize:
-
The ColorMatrix algorithm that was used in the first version of Coblis was a one night hack severely simplifying the Javascript code of Matthew Wickline, which itself was an adaptation of the Java code of Thomas Wolfmaier in 1999. The author of the ColorMatrix himself said that we should not use it and removed the code, so let's stop using that.
-
The code of Thomas Wolfmaier was inspired by the Meyer and Greeberg paper which was a solid work. But the implementation itself was not carefully validated and the experimental validation in the 1988 paper was not fully convincing. So it's unclear how much we can trust it. Also worth noting that it is rarely mentioned in the academic literature, probably because there is no solid peer-reviewed reference for it.
-
Last, the license of the code is not super permissive, it cannot be used for commercial applications.
Some examples of software using the HCIRN Color Blind Simulation function or the ColorMatrix are:
- Peacock (Python & C++). HCIRN Color Blind Simulation function.
- Sim Daltonism (iOS/macOS). HCIRN Color Blind Simulation function, implemented in OpenGL.
- Colorblindly (chrome extension). Uses the ColorMatrix. Nov 2021 update: now using Viénot 1999.
- G'MIC. Uses the ColorMatrix. Nov 2021 update: now using Viénot 1999.
- Lokno GIST. Uses the ColorMatrix.
Brettel & Mollon 1997
A more modern algorithm for dichromacy simulation was developed by (Brettel, Viénot, & Mollon, 1997). Their paper has become a reference in the research community. An important note is that the research work was performed on an old (but calibrated!) CRT monitor, so implementations of this approach need to be adapted for modern monitors and the sRGB standard.
The most famous implementation is the one of www.vischeck.com. The original source code was in Java, but the Vischeck co-author Bob Dougherty mentions in his webpage that the code is now in GIMP as a display filter. It also had an online version, but the website is now broken. Vischeck is generally considered as a reference in the color science community. The only issue is that this code still uses conversion matrices obtained for CRT monitors, it should probably be adapted to the sRGB standard.
Otherwise there are comparatively few open source implementation of this algorithm as the follow-up (Viénot, Brettel, & Mollon, 1999) paper from the same group proposed a simpler algorithm for protanopia and deuteranopia. However it's worth noting that this newer approach does not work well for tritanopia, so the Brettel 1997 approach is still relevant in that case.
Another popular recent work from (Machado, Oliveira, & Fernandes, 2009) uses Brettel 1997 as its reference and is actually quite similar to it for dichromacy (by design, they tuned the parameters to match it).
Note that even if it was initially developed for full dichromacy, the approach can be adapted to simulate less severe anomalous trichromacy by either linearly interpolating between the original image and the dichromat image or by applying smaller corrections with fixed steps (Flatla & Gutwin, 2012). It looks reasonable in practice, but the interpolation approach was not formally evaluated.
Besides Vischeck, here are some software using this approach:
- Color Oracle (Java, Objective C). Uses Brettel 1997 for the tritanopia mode, with the LMS color model from Vischeck/GIMP. The protanopia and deuteranopia modes use the cheaper Viénot 1999.
- ChromaticVisionSimulator (GLSL shader). Mobile app for Android. Uses a linear interpolation with the original image to simulate anomalous trichromacy. It handles sRGB and the chosen LMS conversion is detailed in the README.md.
- GIMP-dichromacy (Python). Also for GIMP, but as a filter. It implements more color-space options than the Vischeck-based GIMP display filter.
- Colors.jl (Julia).
Viénot, Brettel & Mollon 1999
(Viénot, Brettel, & Mollon, 1999) builds on the Brettel 1997 paper. In a nutshell it simplifies the math and adapts it for digital displays. It has become a very popular reference, in large part thanks to the daltonize algorithm of (Fidaner, Lin, & Ozguven, 2005). That daltonize algorithm aims at improving the color contrasts of a given image for a person with CVD. The first step is to simulate how the image is seen by a dichromat, and then distribute the error w.r.t the original image on the other color channels. That algorithm became very popular and got copy/pasted/adapted many times. Since it used the simulation algorithm of Viénot 1999 in the first step, this approach has become popular along the way too.
For protanopia and deuteranopia the results are reasonably similar between Viénot 1999 and Brettel 1997, so the faster one can be preferred. But again the Viénot paper is not well adapted to tritanopia. The authors themselves only refer to protanopia and deuteranopia in it. In the best case it's just not accurate, but as this article on ixora.io points out, it can even be totally wrong if the red-green projection plane is kept for tritanopia, which happens frequently.
It can also be adapted for anomalous trichromacy like the Brettel 1997 approach, with the same limits about the validation.
Likewise, one challenge when implementing that algorithm is that the original paper was also using CRT monitors, and thus did not use the sRGB standard. So their raw RGB to linear RGB transform has to be adjusted for modern monitors, but many open source code copied the original matrices from (Fidaner, Lin, & Ozguven, 2005) and are thus less accurate.
A worse but also common issue is that the code from (Fidaner, Lin, & Ozguven, 2005) actually did not include any gamma decoding of the input image, so many software just apply the matrices on the raw RGB values of the image and skip the sRGB decoding step altogether. This makes a whole range of colors look way too dark.
Some examples of open source projects implementing it:
-
daltonize.py (Python). Adapted to sRGB, but uses the CIECAM02 sharpened matrix for the RGB->LMS conversion. I think this is debatable for CVD simulation but we'll dive into that in a future post.
-
Ixora.io (Processing). Adapted to sRGB and uses the Hunt-Pointer-Estevez matrix for RGB->LMS.
-
daltonize.org (several languages). Most software listed there are adaptation of (Fidaner, Lin, & Ozguven, 2005). And most forget the sRGB decoding altogether and still use the original CRT RGB->XYZ conversion.
-
tsarjak/Simulate-Correct-ColorBlindness (Python). Also extends the approach to anomalous trichromacy by linearly interpolating between the original image and the dichromat image. Still uses the original RGB<>LMS conversion for CRT monitors.
Machado 2009
Even more recently (Machado, Oliveira, & Fernandes, 2009) proposed an approach that supports both dichromacy and anomalous trichromacy in a principled way. They also made the nice and very welcome effort to publish easy-to-use matrices on their website and it is becoming more and more popular.
As mentioned earlier it is actually very similar to Brettel 1997 for dichromacy as they tuned their scaling parameters to match it. However it does not work very well for tritanopia as their model is to shift the peak response of the faulty kind of cone cells, and how it should be shifted is unclear for tritanopes. They also did not do any experimental validation with tritanopes, and the paper says:
Since there are no strong biological explanations yet to justify the causes of tritanopia and tritanomaly, we simulate tritanomaly based on the shift paradigm only as an approximation to the actual phenomenon and restrain our model from trying to model tritanopia.
For protanomaly and deuteranomaly the results are reasonably similar to the variant of Brettel 1997 that interpolates with the original image, but since the Machado approach is more principled in that case it may be preferred.
Here are some examples of software using this approach:
-
colour-science.org (Python). Also has code to re-compute the predefined matrices. Overall a very comprehensive reference for anything color-related.
-
colorspacious (Python). Uses the precomputed matrices.
-
Chromium and Mozilla used to rely on the ColorMatrix (Coblis v1) algorithm but fortunately now rely on the Machado approach.
So which one should we use?
Given the limits of the existing algorithms I would recommend different methods depending on the kind of deficiency:
-
For tritanopia the Brettel 1997 approach is still the most solid and basically only valid choice. For tritanomaly I'd also recommend it with an interpolation factor with the original image, but this is more debatable.
-
For protanopia and deuteranopia Viénot 1999, Brettel 1997 and Machado 2009 are solid choices, with a slight advantage for Viénot because it behaves a bit better with extreme values. For protanomaly and deuteranomaly Machado is more principled than linearly interpolating with the original image so it could be a better choice. Compute-wise Viénot 1999 and Machado 2009 are similar (one 3x3 matrix multiplication per pixel), but Brettel 1997 is a bit more expensive (two 3x3 matrix multiplication + some ratio test). Still very cheap on modern computers though.
-
Coblis V1 (ColorMatrix) should never be used. Coblis V2 may be ok for protanopia and deuteranopia (ideally after adjusting it to use sRGB instead of a generic gamma), but given the restrictive license and the lack of careful validation I would not recommend it.
More discussion and comparisons can be found in the (Simon-Liedtke & Farup, 2016) paper. It includes an evaluation of the (Kotera, 2012) method, which I did not include as I haven't found open source implementations, and it performs worse than Viénot and Brettel in that study.
Also worth reading is the evaluation of (Lillo, Álvaro, & Moreira, 2014), also concluding that Brettel 1997 (using Vischeck's implementation) is pretty accurate. They also evaluate Coblis, concluding that it is pretty inaccurate. But given the dates it was probably V1, so it does not allow us to conclude about Coblis V2.
One last thing to keep in mind in that there are many ways to implement the RGB to LMS color space conversion, so it's a little bit of a jungle there. We discuss that more in depth in our Understanding LMS-based Color Blindness Simulations article, but the good news is that in most cases the final results will still be reasonable.
Update Nov 2021. I've been collecting feedback in a r/colorblind reddit thread, and it seems that Brettel 1997 and Viénot 1999 are the clear winners (once adapted to sRGB). Machado 2009 consistently ranks lower. I think one big issue with Machado 2009 is that a proper sRGB decoding was not implemented (see the discussion here). It was likely not a problem for their evaluation using color with medium brightness (as suggested in this thread in bugzilla), but it is for the full range of colors. Following that it's also unclear how they tuned their parameters to match the output of Brettel 1997, did they include sRGB decoding or not? Given this I would only recommend to try it for anomalous trichromacy (with un-evaluated accuracy, but at least a sound theory), but not full dichromacy.
I just want to copy some code!
Ok, so while writing this article I realized that we still didn't have a single place to look for a reference implementation that developers can just copy/paste/adapt. This is why I've written a number of different implementations:
-
libDaltonLens, a minimalistic single-file library with a public domain license that tries to fix that. It's in C, with zero dependencies, and unit tested against reference implementations.
-
DaltonLens-Python has unit-tested implementations of the 3 methods discussed above. It is targeted towards experimentation and research, so it's a bit less minimal.
-
DaltonLens for desktop has an OpenGL version of that code
-
libDaltonLens also include SVG filters, including Brettel 1997 for tritanopia, which was not trivial to implement. Here is a live demo.
Otherwise I'd recommend these open source software:
-
Brettel 1997: the Vischeck display filter for GIMP. The RGB to LMS matrix should be updated for sRGB, but it's still ok in practice and Vischeck was the most validated software overall. Beware that the code does not include the sRGB->RGB conversion since GIMP does that before calling that code. Also note that the license is GPL.
-
Viénot 1999: daltonize.py (Python).
-
Machado 2009: colour-science.org (Python). Pretty easy to implement overall with the precomputed matrices.
Show me some images!
[Update Nov 2021] try our online color blindness simulator, it lets you try all these methods live by wrapping DaltonLens-Python in the browser.
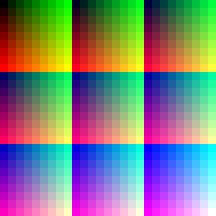
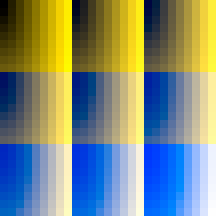
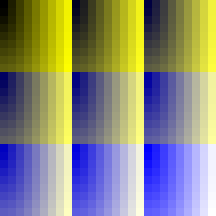
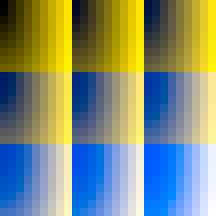
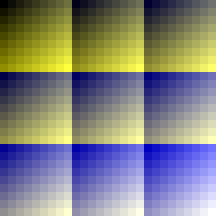
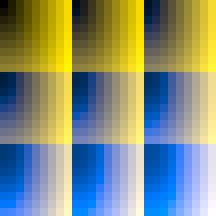
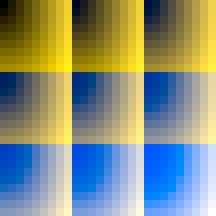
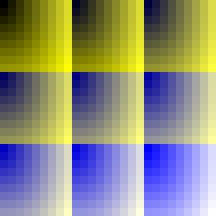
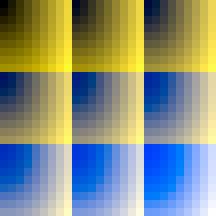
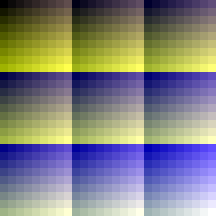
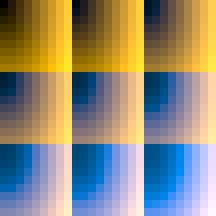
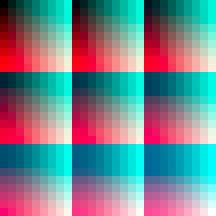
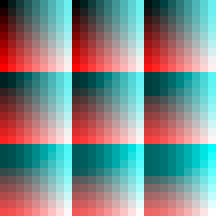
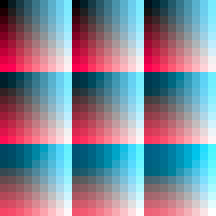
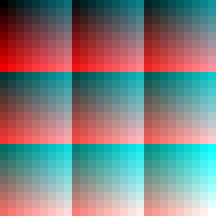
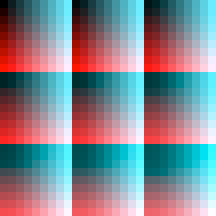
Let's get an idea of the output of each method. The input image covers the full RGB range. These results are for full dichromacy, so people with a mild CVD will likely see significant differences between the original and the simulated images for all models.
The images were generated using the implementation of each method in DaltonLens-Python, with the exception of Coblis V1 and V2 which respectively come from skratchdot/color-matrix and Peacock. Overall it confirms that Coblis V1 (the ColorMatrix) is very broken. The other algorithms have some differences but fortunately still generally agree for protanopia and deuteranopia. For tritanopia Brettel 1997 is significantly different and should be more accurate as the other models were not designed to be compatible with tritanopia.
For protanopia
Overview
| Original | Machado 2009 | Viénot 1999 |
|---|---|---|
|
|
|
| Brettel 1997 | Coblis V1 | Coblis V2 |
|
|
|
One by one
How accurate are these simulations?
Brettel 1997, Viénot 1999 and Machado 2009 have a fairly solid theoretical background, but they still remain approximate mathematical models of the complex human perception of colors. So how good are they at simulating how a person with CVD perceives colors? Several studies have attempted to validate these experimentally. A first step is to ask a person with CVD to validate whether the original image and the simulated image look similar, which is what Brettel 1997 did. More elaborate studies compared how people with CVD and people with normal vision perform on color tests or color-related tasks. On the original images people with normal vision are expected to perform better, but when given the simulated images they should perform similarly as the people with the corresponding CVD, if the simulation is accurate. (Simon-Liedtke & Farup, 2016) show that the Brettel model is pretty good at least for deuteranopes, and (Machado, Oliveira, & Fernandes, 2009) showed pretty good results for protanopes and deuteranopes for their method, which is similar to the Brettel one for full dichromacy.
There are still some serious limits though, so all these models have to be taken with a grain of salt:
-
So far we've mostly discussed dichromacy, where one kind of cone is entirely missing. But most people actually have anomalous trichromacy, where the deficient cones are still either present but with less density, or shifted towards another cone, limiting its discriminative power. For those the dichromat models will look too extreme as they can perceive more colors and see a difference between the original and simulated images.
-
All these models are based on average observers. But there are great individual variations. For example Brettel 1997 noted that some experiments on 4 deuteranopes showed that two had a spectral peak of 558 nm for two of them, and 563nm for the other two. So ideally the parameters of the models would need to get adjusted for each person.
-
These models assumed that only the lowest level of color perception is affected, and ignore the plasticity of the brain that can potentially adapt and change the color perception at higher levels. These simulations do not model anything like that.
-
The validation experiments are generally made on a very small population, rarely more than 10 people. And tritanopes are basically never evaluated since they are very rare and hard to find.
-
Most people will look at these simulations on an uncalibrated computer screen in a room with some kind of background illumination. Without a proper calibration of the monitor the stimuli that corresponds to each sRGB value will be inaccurate, and the background illumination may be far from the expected D65 (normal outdoor). Also the brightness, contrast and color balance settings of the monitor can significantly change the color appearance.
-
(Meyer & Greenberg, 1988) noted that the size of the field of view can affect the severity of an individual's deficiency. They refer to (Pokorny & Smith, 1982) that observed how the severity can decrease as the field of view increases. This explains why colors are harder to identify for a person with CVD on small objects like LEDs, but easier on large bright objects. In a more recent paper %{ cite broackes_unilateral_2010 %} argues that our understanding of dichromacy underestimates how much residual color perception can remain, especially for large fields of view. This blog post from Rob Pike also mentions how small objects are much harder to identify for people with a CVD, while larger uniform areas are quite easy. Ideally the simulations should take that into account and adapt the severity of the simulation as a function of the area size, etc. This is completely ignored here, and it's likely that the simulation will look too strong on large objects, even for a full dichromat.
Conclusion
So the good news is that there are quite a few solutions to simulate CVDs. The bad news is there is still a lot of outdated code out, and even for well-intentioned developers it's quite hard to evaluate whether the output of their simulation is correct or not, so I hope that this article can help.
A second issue is that the methods that are easy to implement are generic and were developed from experimental data collected on average observers (and a long time ago!). We're still lacking a great practical way to model individual color vision deficiency profiles and feed that into a simulator. The work of (Flatla & Gutwin, 2012) and (MacAlpine & Flatla, 2016) goes in that direction, but as far as I know there is no open source code for it.
There are also other research work that have remained more confidential so far like (Capilla, Díez-Ajenjo, Luque, & Malo, 2004). While interesting, the main problem here again is that no large-scale validation was performed, so it's hard to know which one is better. That group also did share some Matlab code, but it hasn't been maintained and can't be run without a Matlab runtime from 2011.
This review did not dive into how these methods actually work, if you are interested you can read the followup post Understanding LMS-based Color Blindness Simulations.
- Meyer, G. W., & Greenberg, D. P. (1988). Color-defective vision and computer graphics displays. IEEE Computer Graphics and Applications, 8(5), 28–40.
- Viénot, F., Brettel, H., & Mollon, J. D. (1999). Digital video colourmaps for checking the legibility of displays by dichromats. Color Research & Application, 24(4), 243–252.
- Brettel, H., Viénot, F., & Mollon, J. D. (1997). Computerized simulation of color appearance for dichromats. Journal of the Optical Society of America. A, Optics, Image Science, and Vision, 14(10), 2647–2655. https://doi.org/10.1364/josaa.14.002647
- Machado, G. M., Oliveira, M. M., & Fernandes, L. A. F. (2009). A physiologically-based model for simulation of color vision deficiency. IEEE Transactions on Visualization and Computer Graphics, 15(6), 1291–1298. https://doi.org/10.1109/TVCG.2009.113
- Flatla, D. R., & Gutwin, C. (2012). "So that’s what you see": building understanding with personalized simulations of colour vision deficiency. Proceedings of the 14th International ACM SIGACCESS Conference on Computers and Accessibility, 167–174. New York, NY, USA: Association for Computing Machinery. https://doi.org/10.1145/2384916.2384946
- Fidaner, O., Lin, P., & Ozguven, N. (2005). Analysis of Color Blindness.
- Simon-Liedtke, J. T., & Farup, I. (2016). Using a Behavioral Match-to-Sample Method to Evaluate Color Vision Deficiency Simulation Methods. Journal of Imaging Science and Technology, 60(5), 504091–504099. https://doi.org/10.2352/J.ImagingSci.Technol.2016.60.5.050409
- Kotera, H. (2012). Optimal daltonization by spectral shift for dichromatic vision. Color and Imaging Conference, 2012, 302–308. Society for Imaging Science and Technology.
- Lillo, J., Álvaro, L., & Moreira, H. (2014). An experimental method for the assessment of color simulation tools. Journal of Vision, 14(8), 15. https://doi.org/10.1167/14.8.15
- Pokorny, J., & Smith, V. C. (1982). New observations concerning red–green color defects. Color Research & Application, 7(2), 159–164.
- MacAlpine, R., & Flatla, D. R. (2016). Real-Time Mobile Personalized Simulations of Impaired Colour Vision. 9.
- Capilla, P., Díez-Ajenjo, M. A., Luque, M. J., & Malo, J. (2004). Corresponding-pair procedure: a new approach to simulation of dichromatic color perception. Journal of the Optical Society of America. A, Optics, Image Science, and Vision, 21(2), 176–186. https://doi.org/10.1364/josaa.21.000176